

Research & DevelopmentSaltcake Media Lab
Saltcake, A Dashboard That Makes Every Day Fun
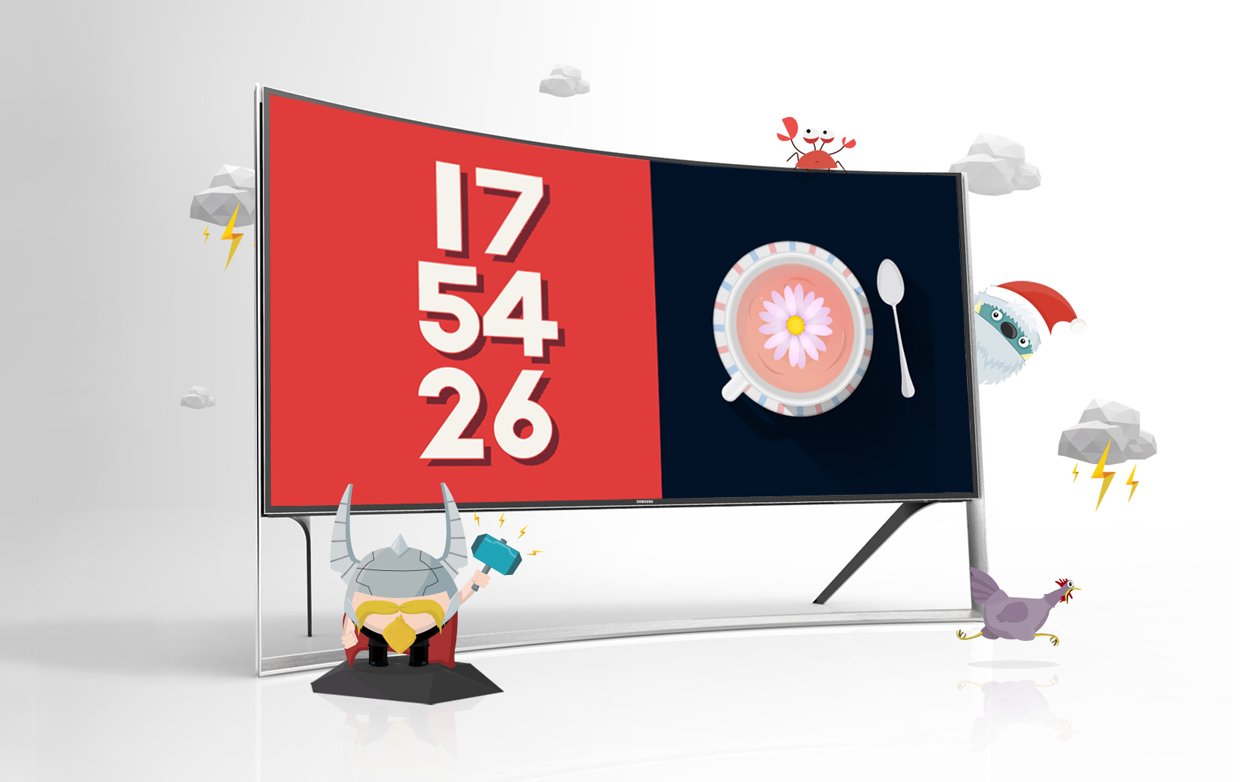

An in-office dashboard that shows Saltcake news with playful animation.
Project Information
- Industry
- Research & Development
- Project Type
- Experimental
- Role
- Application (AS3), Animation, API Integration
- Client
- Saltcake Media Lab
- Client
Introduction - Saltcake Media Lab is Saltcake’s in-house research team, experimenting with new technologies and interactions to explore “the essential value of happy experiences.” It builds and exhibits new media technologies such as VR and AR, holograms and motion recognition, and carries the insights gained into the experience design of client projects.
Saltcake Dashboard is an application designed to display information and news related to our company with funny and esthetic animations.
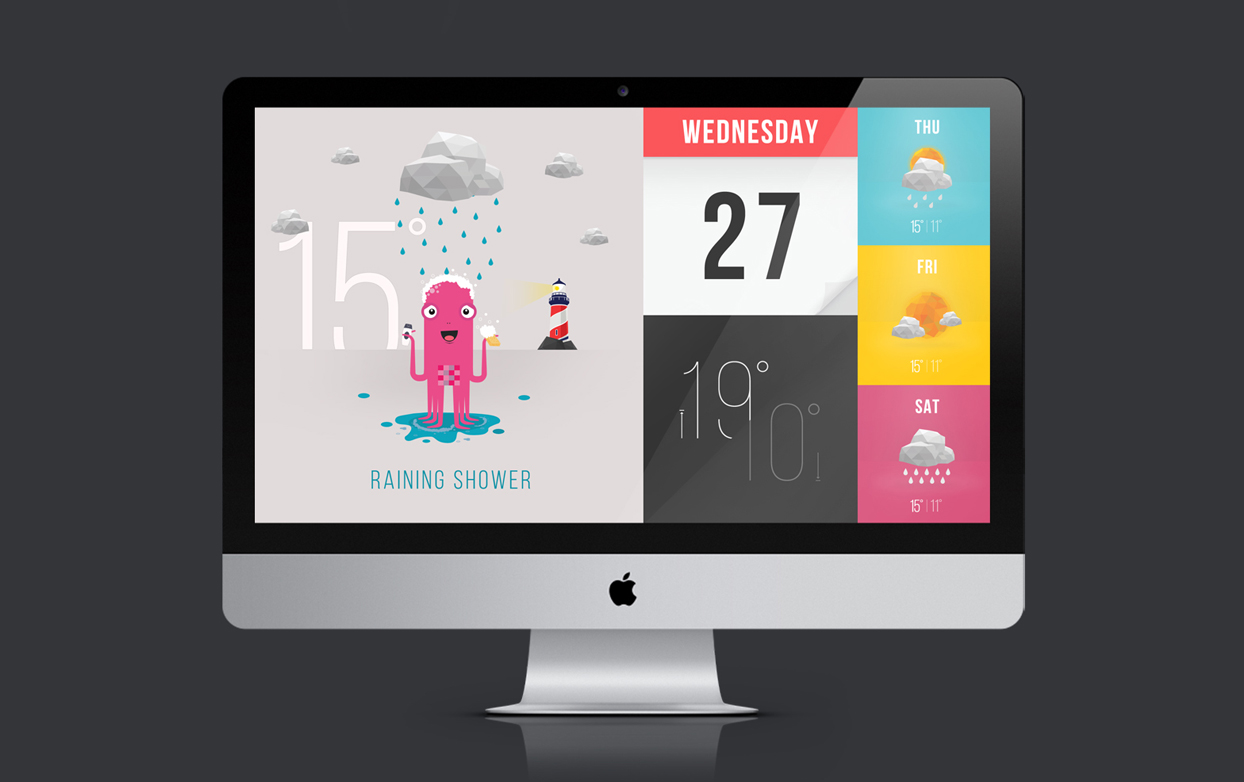
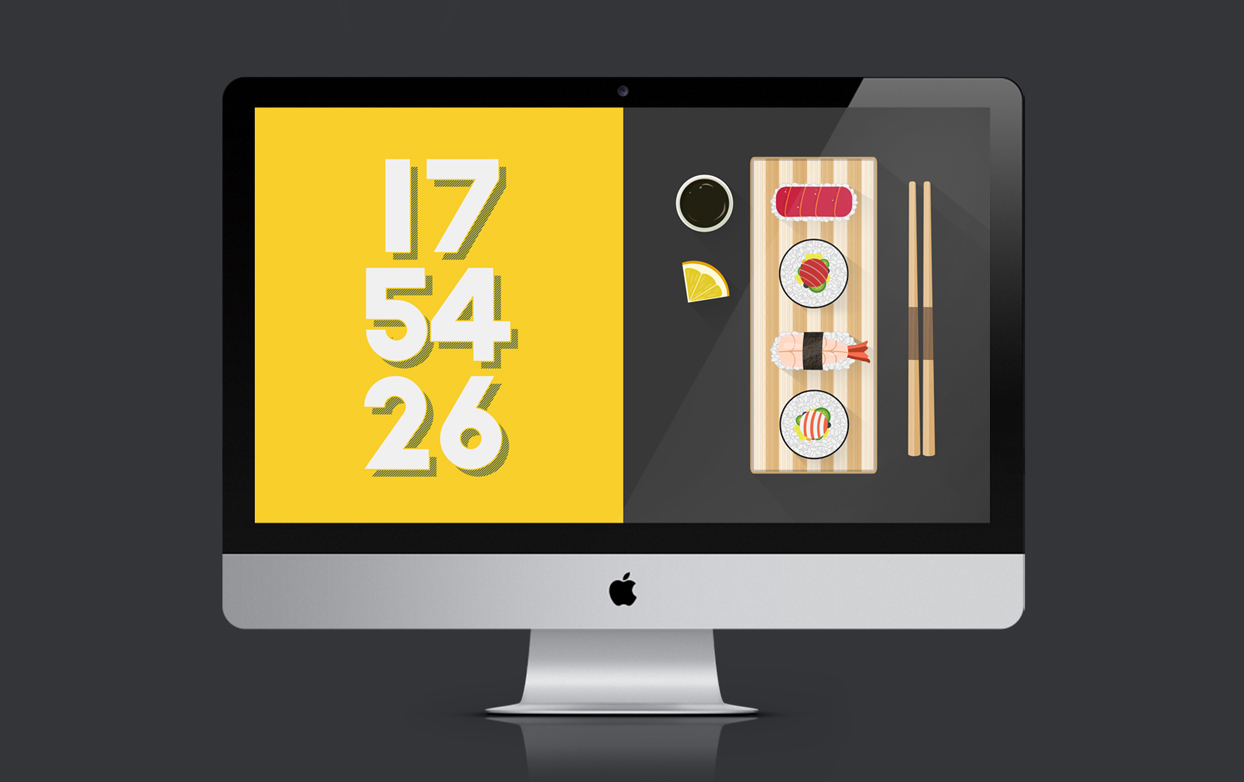
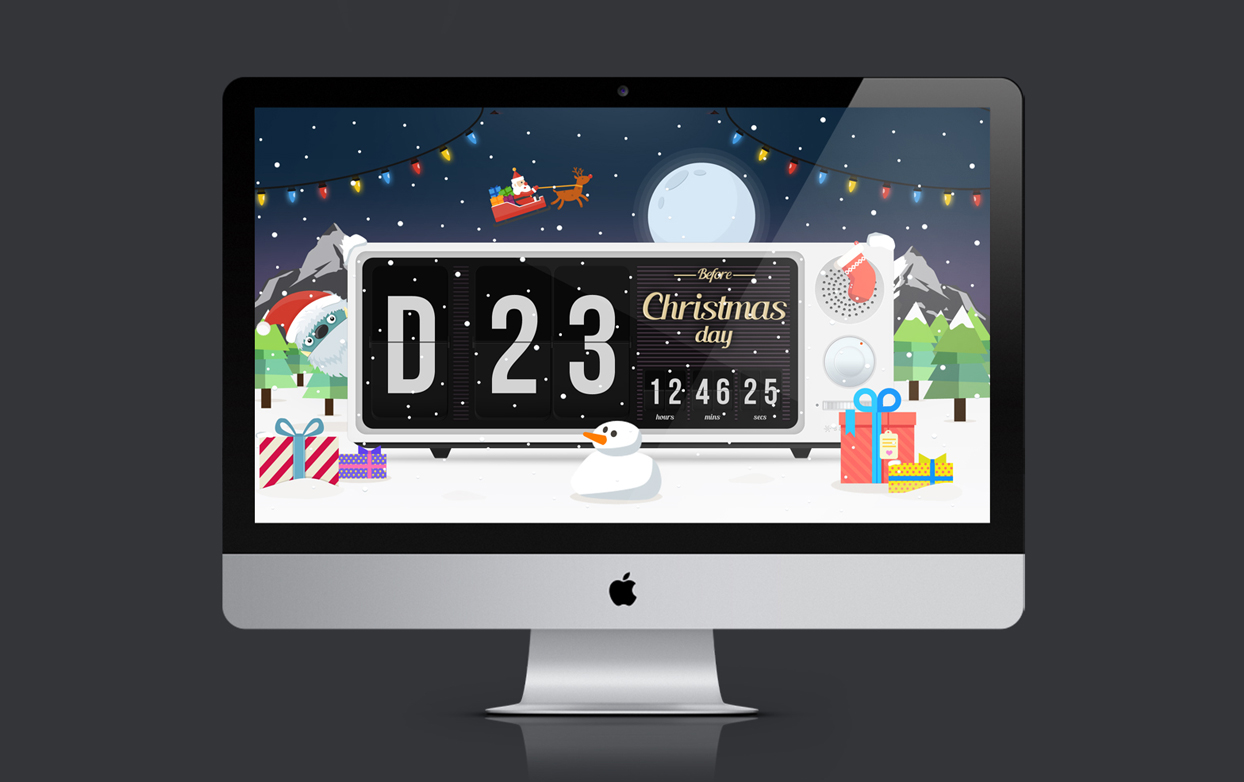
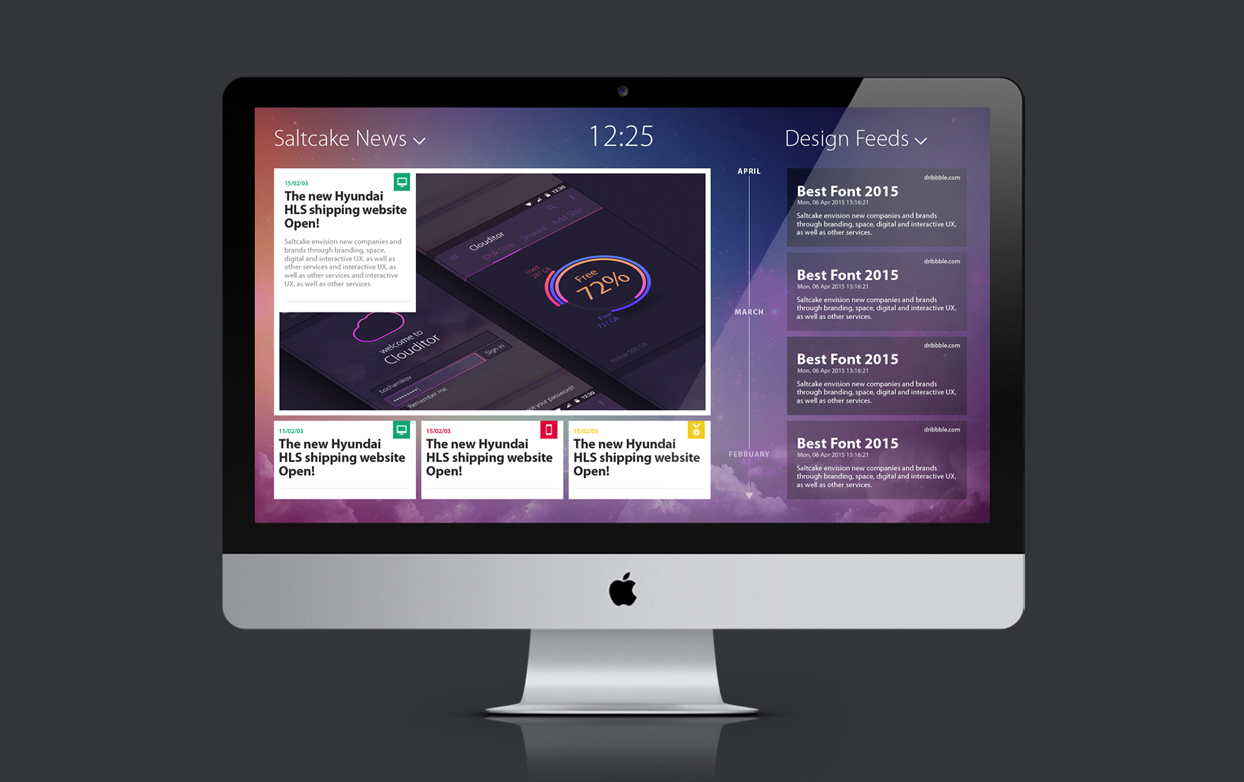
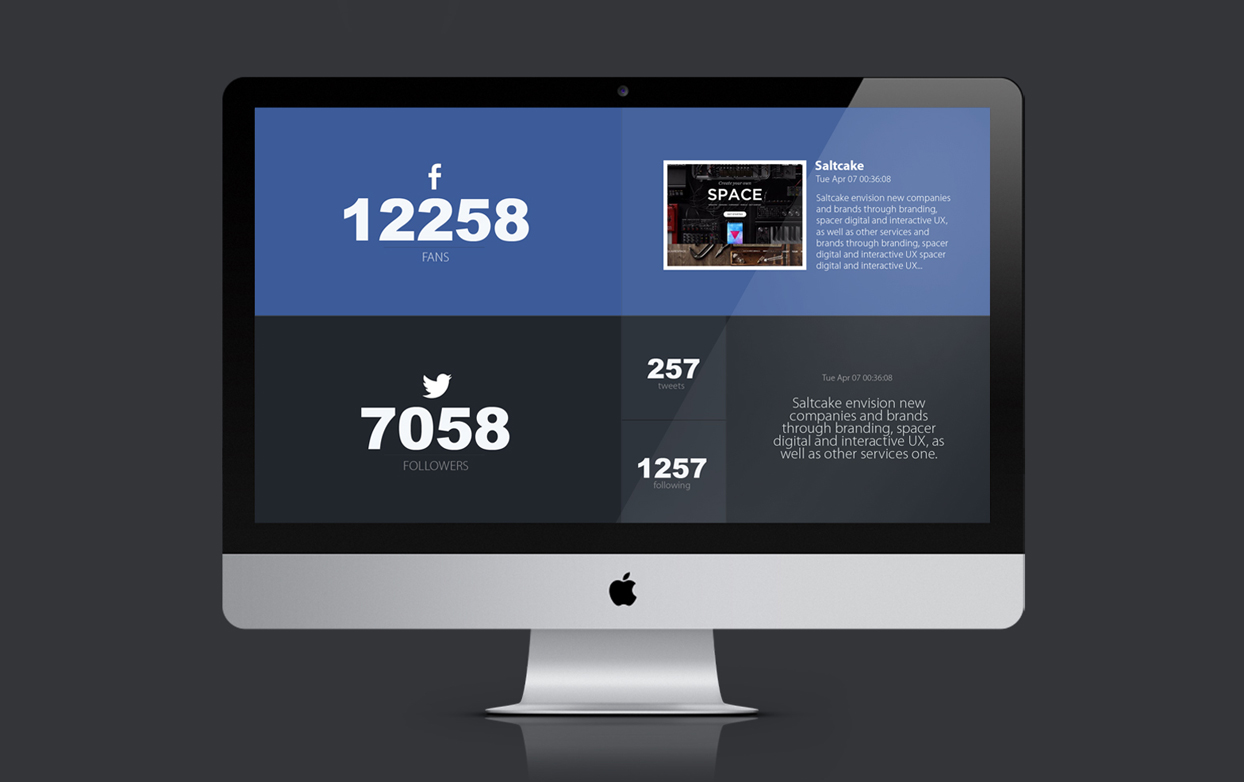
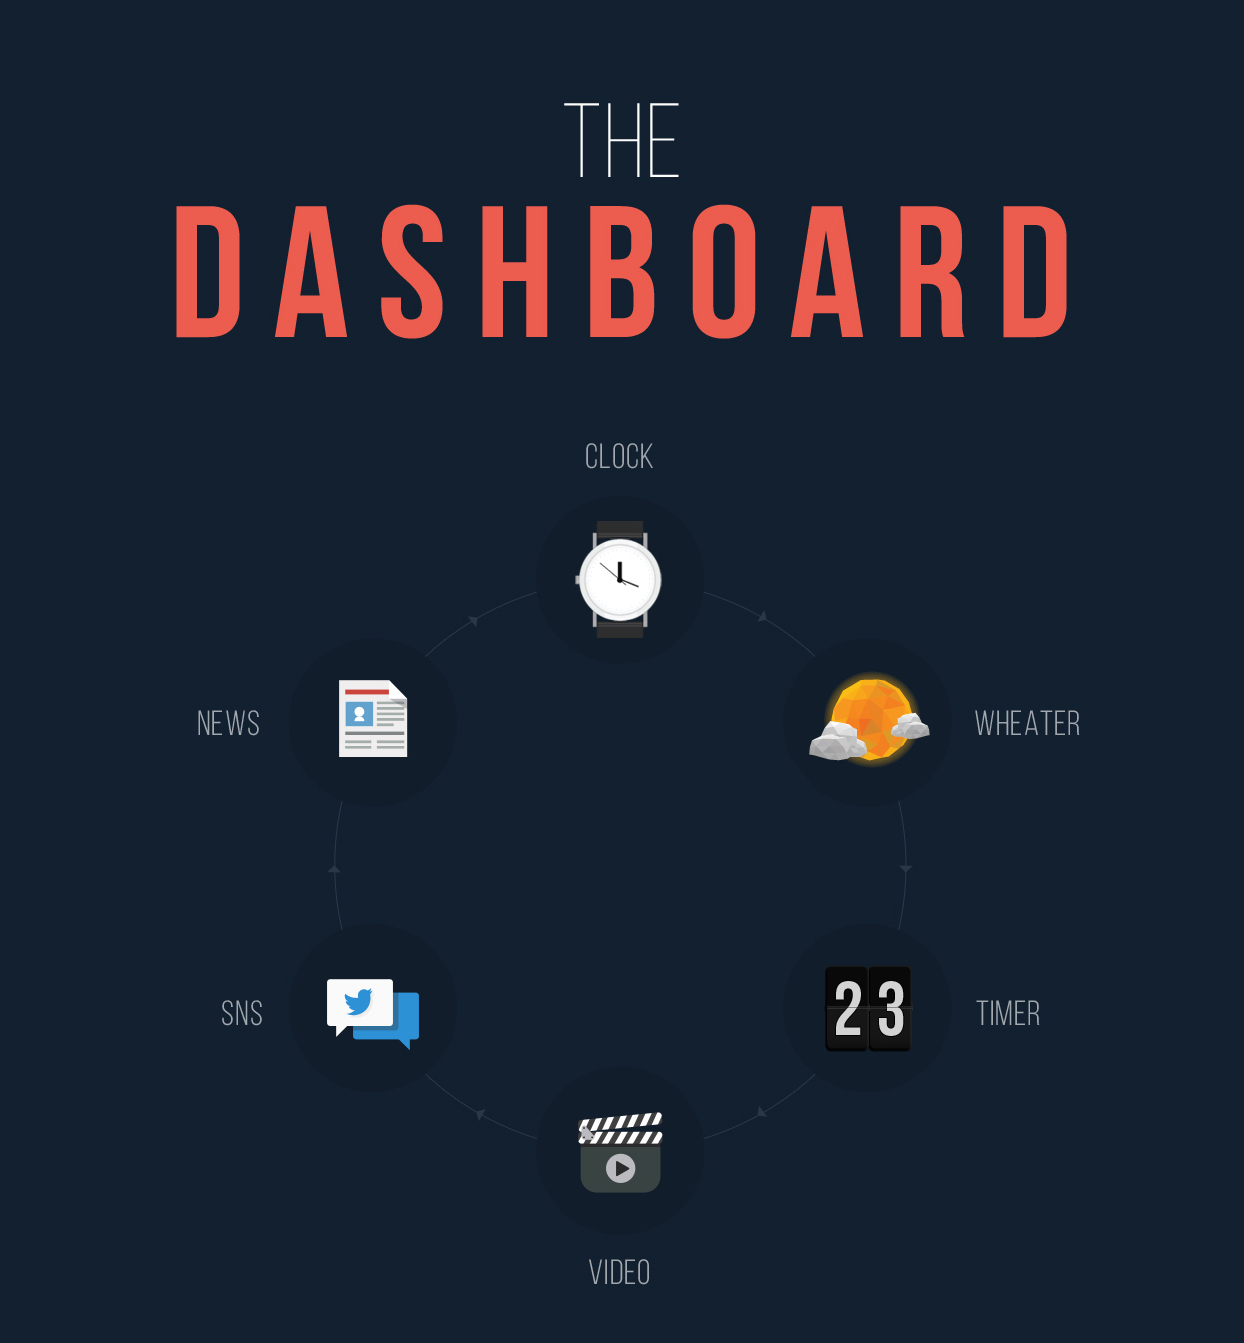
The dashboard is a Saltcake application in AS3 that allows centralizing and displaying basic and essential information of our company in our office and during our participation to show, fair and exhibition. The dashboard, connected to internet, a database and APIs is totally independent. The Dashboard is composed in 6 parts which are automatically looped all along the day. A customized clock displays time and animations according the moment of the day. A personal animated weather forecast based on Yahoo Weather API shows real weather with funny animations and weather forecast for next 3 days. A SNS notifier displays our last posts and followers for our Facebook and Twitter. A Saltcake news which is an overview of the latest news at Saltcake and in design world. A timer event counts how long left before the next event (Christmas, Chuseok or company anniversary for example). And the latest Saltcake projects with dynamic videos.
The Saltcake Dashboard is a program that provides company news, the latest updates, and design trend information. It features six rotating sections: Clock, Weather, Timer Event, News, SNS, and VOD. Using the Yahoo Weather API, it delivers real-time weather, time, and timer information. / Each time zone and event is represented through symbolic illustration animations, making the interface easy and enjoyable for anyone to use.
Facing a similar challenge?
Contact